Getting Started
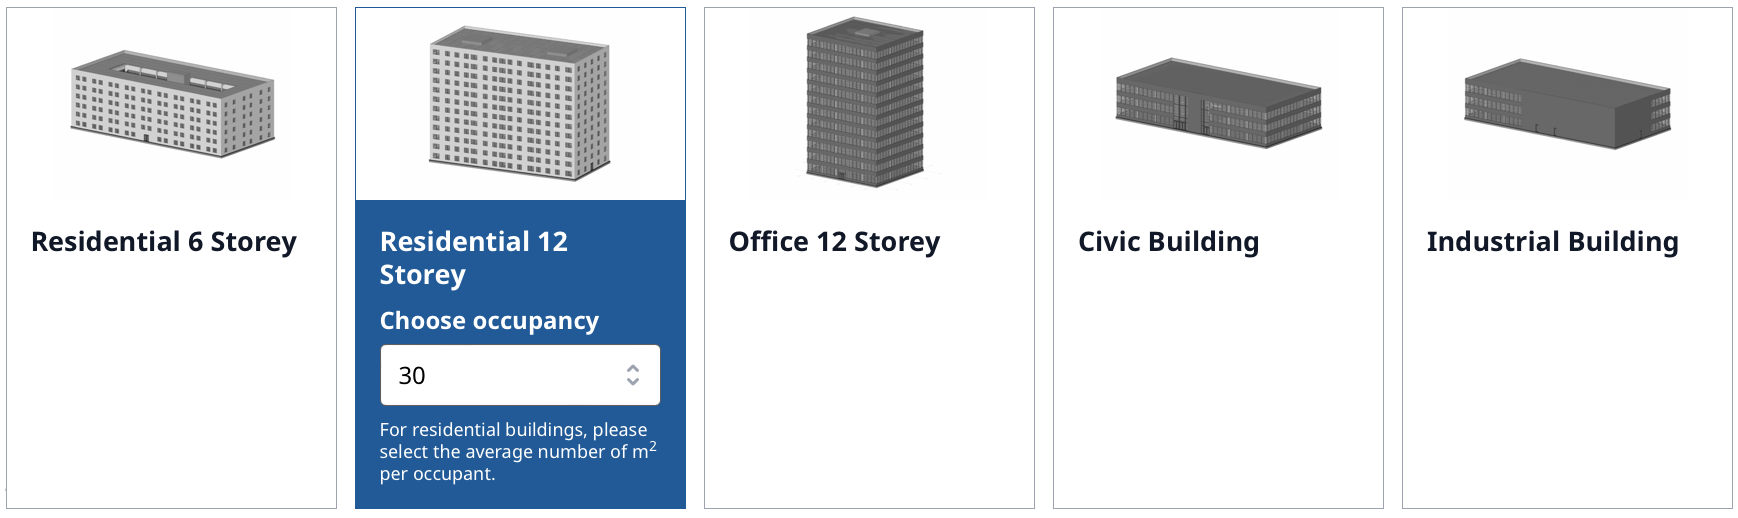
Select Your Archetype
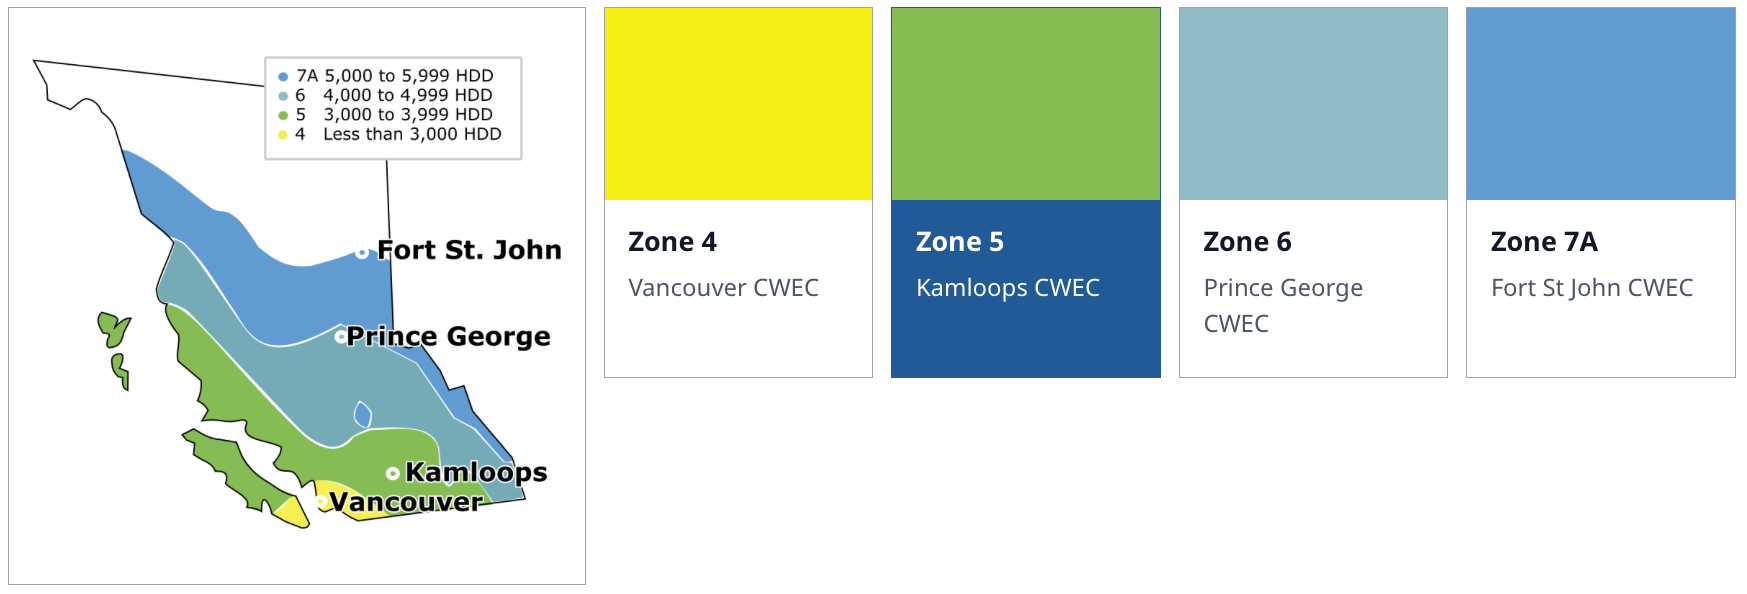
The dataset contains a comprehensive overview of energy performance, utility and construction costs, and level of BC Step Code compliance, for eight different mass timber archetypes, situated in four regions of BC. Those regions are Vancouver, Kamloops, Prince George, and Fort St John.
Select the archetype that best fits the project. Each archetype represents building designs for a specific purpose. For the residential buildings, select the occupancy density. A setting of 30 m²/occupant is a typical density used in many residential projects.
Select Your Location
Select the zone that best fits the project's location. For example, if the building is in Victoria, select the yellow region on the map (Zone 4, Vancouver CWEC).
The performance of the building is dependent on the climate. Generally, to capture the variance in performance and weather, buildings are modeled for a specific climate zone. The climate zones are based on a typical weather year for a city, called a Canadian Weather Year for Energy Calculation (CWEC).
Using the Parameter Sliders
This graphic shows all buildings available in the dataset. Each line is a single building configuration. The lines intersect with the various parameter axes, indicating the settings for that building.
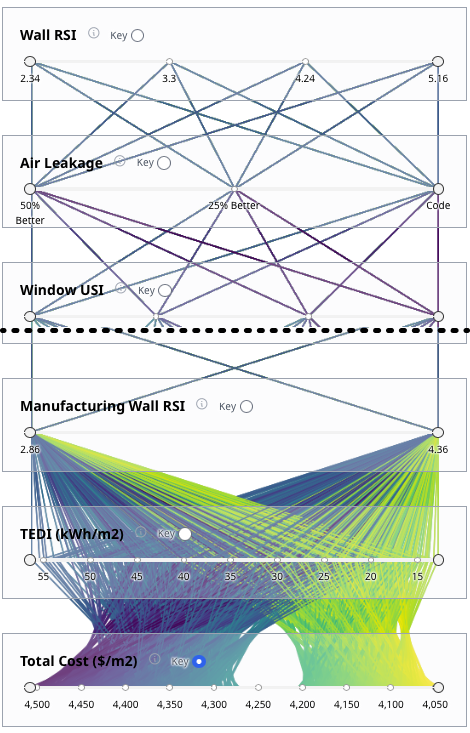
Use the sliders to reduce the number of building combinations of energy use (as TEDI) and cost (as Total Cost ($/m)).
To learn more about each parameter, click on the text next to the (i) icon. Descriptions are provided next to each parameter in the tool and can be found in the Glossary, below.
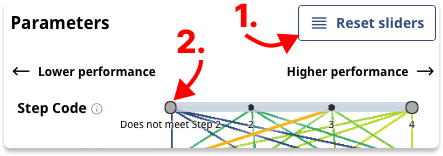
- To refine the buildings to consider in the design, use the sliders to limit the number of possibilities.
- Reset all of the sliders using the Reset sliders button at the top right.
Table Content
The table in the tool allows analysis and comparison of the various building designs.
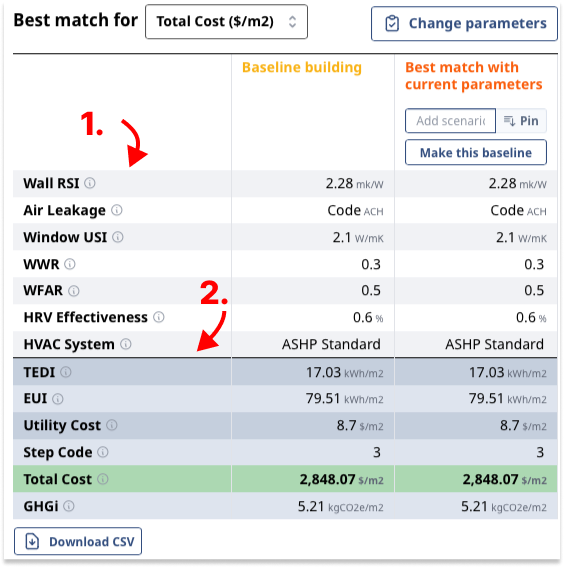
- On the left are the different parameters to compare.
- The parameters that change the design of the building, such as Wall RSI, Air Leakage, etc. are all above the line, while the model outputs, compliance code, and cost parameters are below the line.
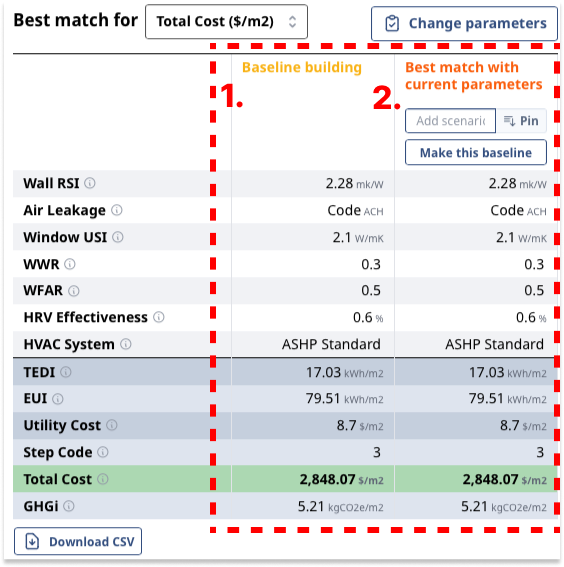
- The baseline building (yellow header) is considered the typical building. The baseline building is used to find the premium of a change to that typical design. By default, this is set to the cheapest building in the dataset.
- Best match with current parameters (orange header) displays the best match given either Total Cost, Total Energy Use, Greenhouse Gas Emissions, or Step Code Level. The best match will be found among the available building configurations set by the sliders.
Customizing and Storing your Comparisons
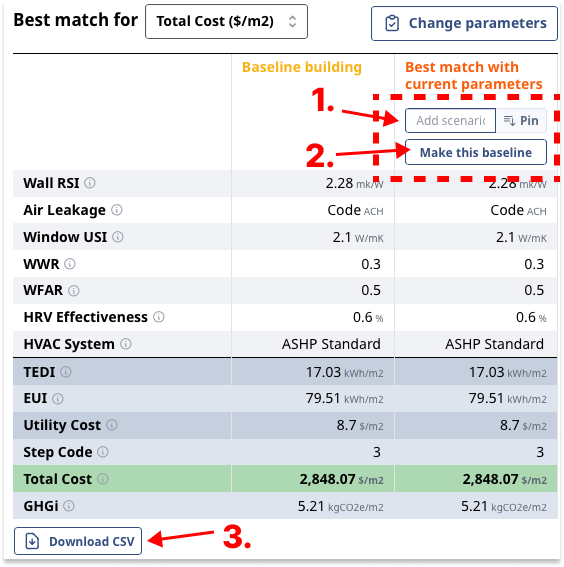
- Add stored scenarios. In the Add scenario input box, create a name, then click on the Pin button to create an additional scenario column.
- Set a different baseline building. You can replace the building in the Baseline column with the building in the Best match with current parameters column. This allows a comparison of the premium against a custom-set baseline building.
- Download the table and data as a CSV file to use as a proforma.
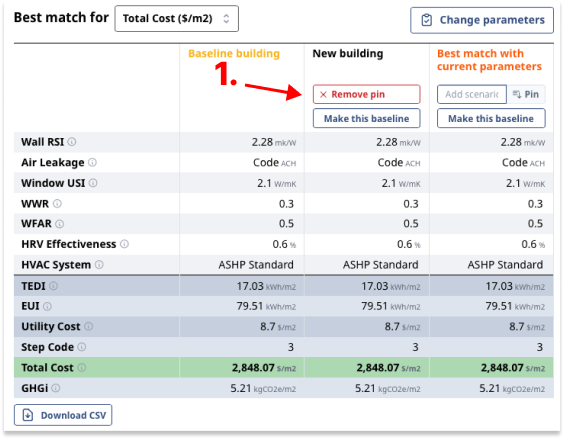
- After a scenario has been pinned you can remove the scenario from the table using the Remove pin button.
Glossary
- Air Leakage
- The measure of unwanted air changes through the building envelope is a measure of the air tightness of the building. The options provided for the user are Code and percent better than Code. Code is set based on national building energy standards code while percent better is achieved by improving the air barrier system above Code. Reaching improvements in the air infiltration can greatly reduce the heating load in buildings, however this requires planning, coordination, and process changes during construction.
- CEDI (kWh/m²)
- Cooling Energy Demand Intensity
- CEDI is the measure of annual cooling load in kWh/m²/year of the building (how much cooling energy the cooling equipment must deliver to maintain space temperatures).
- Climate Zone
- The building will perform differently when situated in different regions in BC. Each region is modelled based on a single representative city using its Canadian Weather year for Energy Calculation (CWEC). Climate zone 4 weather is based on Vancouver CWEC (4), climate zone 5 Kamloops CWEC, climate zone 6 Prince George CWEC, and climate zone 7a Fort St John CWEC. More information on the CWEC can be found here.See also Step Code
- Electricity EUI (kWh/m²)
- Electricity Energy Use Intensity
- The total electricity use of the building per square metre of gross floor building area, in kW/m²/year.See also EUI
- EUI (kWh/m²)
- Energy Use Intensity (EUI)
- This metric in kWh/m²/year looks at the absolute energy use of the building over the building floor area. It includes all energy use of the building such as for example plug loads, heating, cooling, lighting, ventilation, and other systems. It includes the construction quality of the building and accounts for building use and climate.
- EUI Improvement vs NECB
- This metric looks at the relative energy savings of a particular design over an NECB Reference Building. The NECB Reference Building uses a natural gas boiler plant to supply hydronic terminal space heating systems. Since the NECB Reference Building fuel sources vary depending on the design, it was deemed more appropriate to use a fixed fuel source for this metric, based on the most common heating systems used in BC.See also EUI
- Gas EUI (kWh/m²)
- Gas Energy Use Intensity
- The total gas use in kWh/m² of the building per square metre of gross floor building area.See also EUI
- GHGi (kgCO₂e/m²)
- Green House Gas Emissions Intensity (GHGi)
- This metric in tCO₂/m²/year provides the absolute GHG emissions per square metre per year for the building. A lower GHGi building will emit less carbon during its operation.
- GHGi Improvement vs NECB
- The relative GHG savings of a particular design over a gas based NECB reference building (i.e. an NECB Reference Building that uses a natural gas boiler plant to supply hydronic terminal space heating systems). Since the NECB Reference Building fuel sources vary depending on the design, it was deemed more appropriate to use a fixed fuel source for this metric based on the most common heating systems used in BC. This metric focuses on GHG emissions rather than energy savings in the Energy Savings over NECB metric.See also GHGi
- NECB Electricity EUI (kWh/m²)
- NECB Electricity Energy Use Intensity
- The number provides the electricity use intensity of that comparable building. For each archetype a comparable building was created and modelled which adheres to the National Energy Code of Canada for Buildings (NECB) Code. The NECB Reference Building uses a natural gas boiler plant to supply hydronic terminal space heating systems.See also EUI
- NECB EUI (kWh/m²)
- NECB Energy Use Intensity
- This number provides the absolute energy use intensity of that comparable building. For each archetype, a comparable building was created and modelled which adheres to the National Energy Code of Canada for Buildings (NECB) Code. The NECB Reference Building uses a natural gas boiler plant to supply hydronic terminal space heating systems.See also EUI
- NECB Gas EUI
- This number provides the gas use intensity of a given comparable building. For each archetype, an NECB Reference Building was created and modelled adhering to the National Energy Code of Canada for Buildings (NECB). The NECB Reference Building uses a natural gas boiler plant to supply hydronic terminal space heating systems.See also EUI
- NECB GHGi (kgCO₂e/m²)
- NECB GreenHouse Gas Intensity
- This number provides the greenhouse gas emissions intensity of an NECB Reference Building. For each archetype, a reference building has been created and modelled adhering to the National Energy Code of Canada for Buildings (NECB). The NECB Reference Building uses a natural gas boiler plant to supply hydronic terminal space heating systems.See also GHGi
- NECB Utility Cost ($/m²)
- This number provides the utility costs of that comparable building. For each archetype a comparable building was created and modelled which adheres to the National Energy Code of Canada for Buildings (NECB) Code. The NECB Reference Building uses a natural gas boiler plant to supply hydronic terminal space heating systems.
- Occupancy Density (m²/occupant)
- m² per occupant
- For residential buildings you will need to supply an occupant density. The levels we have prepared are 20 for highest density projects, 25 for high density, 30 considered a typical density, and 35 is a low density project.
- Peak Electricity (kW/m²)
- Peak Electricity Use
- The Peak energy use in kW/m² supports in-site and infrastructure planning. Lowering this metric improves the burden on the existing capacity
- Roof RSI (m²k/W)
- Roof Resistance
- The insulating value of a roof is indicated by its RSI value. The higher this value the lower the heat loss through the surface. The units used in the Mass Timber Navigator are the metric K·m²/W. To convert between RSI and commonly found R-value, use 1 K·m²/W = 5.678 (hr·ft²·°F)/Btu.See also Wall RSI, Window USI
- SHGC
- Solar Heat Gain Coefficient (SHGC)
- The fraction of incident solar radiation that is admitted to a building through the windows is called the solar heat gain coefficient (SHGC). A window with an SHGC of 0.4 admits 40% of the sun's energy and reflects or absorbs the rest. A wide range of SHGC’s are available depending on manufacturer and glazing type. A range of 0.2 to 0.4 is most common.See also Window USI
- Step Code
- Equivalent Step Code
- The BC Building Code has established Step Code targets for some building archetypes. This metric summarizes the achievable Step depending on the design, archetype, and climate zone.See also Climate Zone
- TEDI (kWh/m²)
- Thermal Energy Demand Intensity (Model Output)
- The amount of heating a building requires to offset building envelope losses and temper ventilation air, prior to any mechanical interventions (with the exception of ventilation heat recovery equipment). This metric maximizes passive or near passive systems before looking at heating delivery methods and technology. This metric has been made popular by Passive House, an international high-performance building standard, which promotes highly insulated buildings with exceptional ventilation heat recovery and otherwise simple mechanical systems. More recently, ventilation heat recovery has become a popular design element is critical to achieve higher steps of the BC Energy Step Code.
- Total Cost ($/m² or $/ft²)
- Total Construction Cost Estimate per square meter or square feet
- A total construction cost was estimated for all different configurations of the archetypes. Date: Aug 2021See also Utility Cost
- Utility Cost ($/m²)
- This is the total annualized cost of energy utilities (gas and/or electricity). The costs are based on Aug 2021 prices.See also Total Cost
- Utility Cost Improvement vs NECB (%)
- The relative energy (utility) cost savings of a particular design over a gas-based NECB reference building (i.e. an NECB Reference Building that uses a natural gas boiler plant to supply hydronic terminal space heating systems). Since the NECB Reference Building fuel sources vary depending on the design, it was deemed more appropriate to use a fixed fuel source for this metric based on the most common heating systems used in BC. This metric is focused on utility cost savings that highlights economic impacts of designing beyond minimum code. Energy costs are also presented as a floor area-normalized metric, known as Energy Cost Intensity ($/m²), to facilitate easier comparison of costs across building archetypes.See also Utility Cost
- Wall RSI (m²k/W)
- Wall RSI Value
- The insulating value of a wall is indicated by its RSI value. The higher the RSI value the lower the heat loss through the surface. The units used in the Mass Timber Navigator are Km²/W. To convert between RSI and commonly found R-value, use 1 K·m²/W = 5.678 (hr·ft2·°F)/Btu. A RSI of approximately 2.28 is approximately R13, while a RSI of 4.89 is approximately R28. The value entered here should be the overall system value, not the nominal value of the insulation layer in the wall assembly. The system value accounts for thermal bridging effects from studs, shelf-angles, window-to-wall transitions, etc.See also Window USI, Roof RSI
- WFAR
- Wall to Floor Area Ratio
- For some archetypes, two models were created with different floor to wall ratios. You can change this setting by toggling between a longer building and a more square building.See also WWR
- WWR
- Window to Wall Ratio
- The Window to Wall Ratio is the percent of the total, above grade wall surface that is made up of windows. Windows have greater heat loss than walls; more windows will mean a greater overall heat loss. However, windows also admit solar radiation offsetting heating loads, so a balance is necessary.See also WFAR
- Window USI (K·m²/W)
- The transmittance value of a window is indicated by its U value. The lower the U value the lower the heat loss through the surface. The units used in the Mass Timber Navigator are the metric W/(m²K). To convert between USI and commonly seen U value, use 1 K·m²/W = 0.176 (hr·ft²·°F)/Btu. A window with a USI-value of 1.48 has a U-value of approximately 0.26.